Belleville High School
Recent News About Belleville High School
-

Which former NW Wayne News area high school standouts will be in action in the week starting Mon Nov. 27?
These former NW Wayne News area high school standouts will be in action in the week starting Mon Nov. 27.
-

Which former NW Wayne News area high school standouts will be in action in the week starting Mon Nov. 20?
These former NW Wayne News area high school standouts will be in action in the week starting Mon Nov. 20.
-

Which former NW Wayne News area high school standouts will be in action in the week starting Mon Nov. 13?
These former NW Wayne News area high school standouts will be in action in the week starting Mon Nov. 13.
-

Which former NW Wayne News area high school standouts will be in action in the week starting Mon Nov. 6?
These former NW Wayne News area high school standouts will be in action in the week starting Mon Nov. 6.
-

Which former NW Wayne News area high school standouts will be in action in the week starting Mon Oct. 30?
These former NW Wayne News area high school standouts will be in action in the week starting Mon Oct. 30.
-

Which former NW Wayne News area high school standouts will be in action in the week starting Mon Oct. 23?
These former NW Wayne News area high school standouts will be in action in the week starting Mon Oct. 23.
-
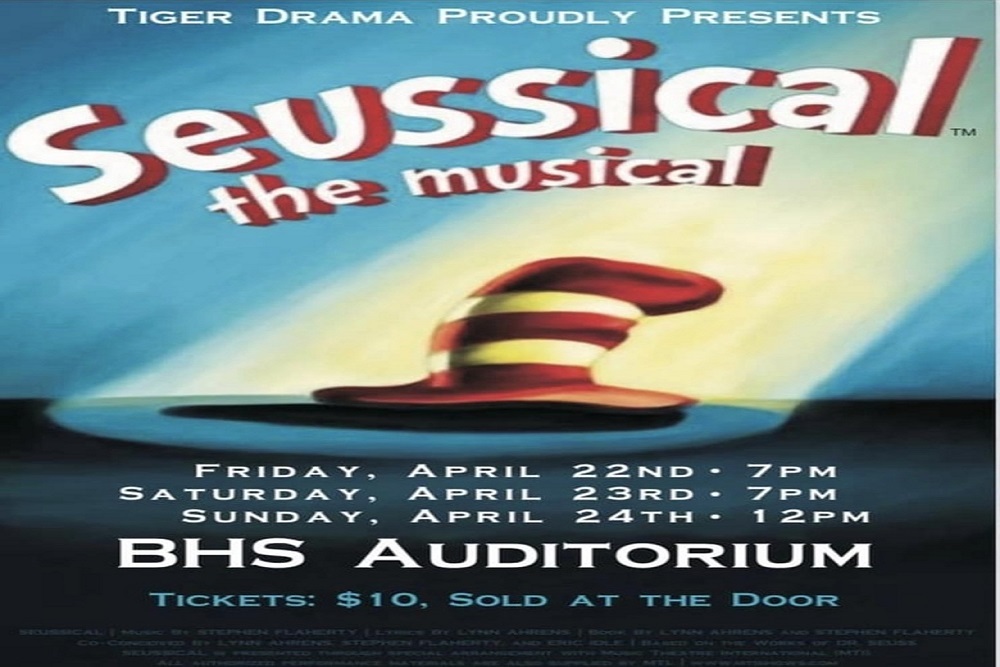
BHS Tiger Drama Proudly Presents Seussical The Musical
BHS Tiger Drama Proudly Presents Seussical The Musical
-

Boys swim team had another record breaking
The boys swim team had another record breaking night in the pool in the 400 Freestyle Relay.
-

Free gun locks available at the Canton Police Department
Free gun locks available at the Canton Police Department's Records Bureau.
-
.jpg)
Older phones may cease operating in early 2022
The National Association of State 911 Administrators (NASNA) is issuing a warning to consumers that older phones may cease operating in early 2022 due to the retirement of 3G networks and support for phones using 3G service.
-

Congratulations to the Football team
Congratulations to the Football team as they defeated Sterling Heights Stevenson 40-26 to earn the schools first trip to Ford Field to play for the State Championship.
-

Saturdays Football SemiFinal
Tickets are now available to be purchased for Saturdays Football SemiFinal matchup vs Sterling Heights Stevenson through GoFan.
-

6th Grade Camp Counselors
Attention Belleville High School students 16 years or older!
-

White students at Belleville High School score 998.5 on average on the SAT (2018-2019)
White students at Belleville High School scored 998.5 on average in the 2018-2019 academic year, a better result than the average for all students in the school.
-

Students with disabilities at Belleville High School score 744.7 on average on the SAT (2018-2019)
Students with disabilities at Belleville High School scored 744.7 on average in the 2018-2019 academic year, a worse result than the average for all students in the school.
-

Male students at Belleville High School score 923.9 on average on the SAT (2018-2019)
Male students at Belleville High School scored 923.9 on average in the 2018-2019 academic year, a worse result than the average for all students in the school.
-

Hispanic students at Belleville High School score 868.6 on average on the SAT (2018-2019)
Hispanic students at Belleville High School scored 868.6 on average in the 2018-2019 academic year, a worse result than the average for all students in the school.
-

Female students at Belleville High School score 945.9 on average on the SAT (2018-2019)
Female students at Belleville High School scored 945.9 on average in the 2018-2019 academic year, a better result than the average for all students in the school.
-

Economically disadvantaged students at Belleville High School score 875.6 on average on the SAT (2018-2019)
Economically disadvantaged students at Belleville High School scored 875.6 on average in the 2018-2019 academic year, a worse result than the average for all students in the school.
